- Syvizo API Management Platform
- Overview
- Getting Started
- Manage Users and Accesses
- Design APIs
- Publish API
- Collaborate
- Validate APIs
- Manage API Flows
- Flow Management
- API Flow Manager
- Policies
- Traffic Management
- Security
- Transformation
- Extension
- Insights
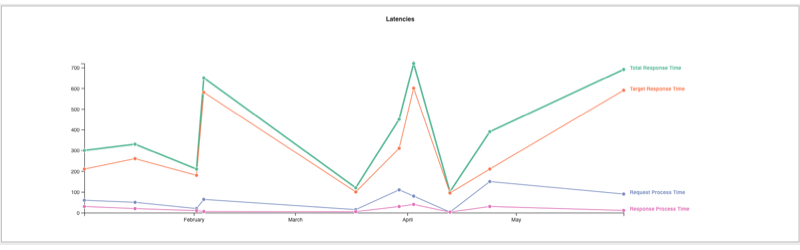
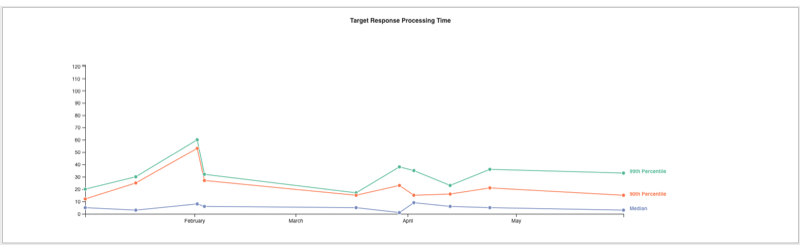
Latency Insights
The Latency Insights dashboard is designed to detect any latency issues occurring within your API proxies. It provides detailed insights into latency measurements, specifically focusing on minute-level intervals. The dashboard highlights key statistics such as the median, 90th percentile, and 99th percentile values.
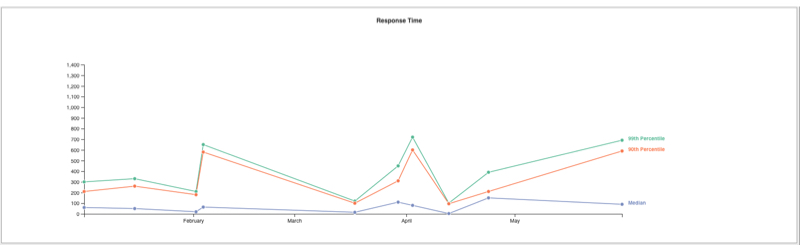
The median value represents the point at which half of your traffic experiences latency below this value, while the other half experiences latency above it. For instance, if the median response time latency for your selected API proxy is 39 ms, it means that half of the responses from this proxy take less than 39 milliseconds, while the other half takes more than 39 milliseconds.
The 90th percentile and 99th percentile values indicate the point at which 90% and 99% of your traffic experience latency below these values, respectively. These percentiles are particularly useful in identifying any exceptional behavior, as they highlight the latency values experienced by the remaining 10% and 1% of your traffic. By identifying these outliers, you can gain valuable insights into latency issues that fall outside the expected range.